Regional Employment and Unemployment
November 15, 2024
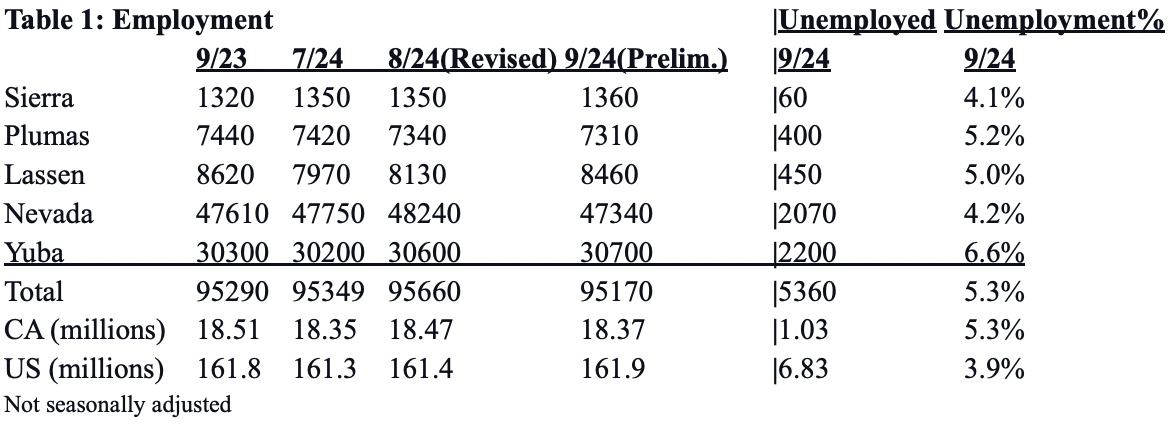
Each month, the labor market analysts for California’s Employment Development Department (EDD) release estimates of employment and unemployment, by county. Last month, on October 18th, the numbers for September 2024 were delivered.

Looking at this small snapshot, in September 2024, we can see every county within the region has an unemployment rate significantly above the nation but the unemployment rate for the region as a whole is equal to California’s. As for the levels of employment within each county listed in Table 1, looking at the changes over the past year, Nevada, Plumas, and Lassen counties all had less employment than was recorded in September 2023. As for the positive employment gains for Sierra and Yuba counties, 3.0% and 1.3%, between September 2023 and September 2024, while nothing to exactly crow about, they did exceed the -0.8% decline in jobs posted for California as a whole and the essentially flat numbers for the nation.
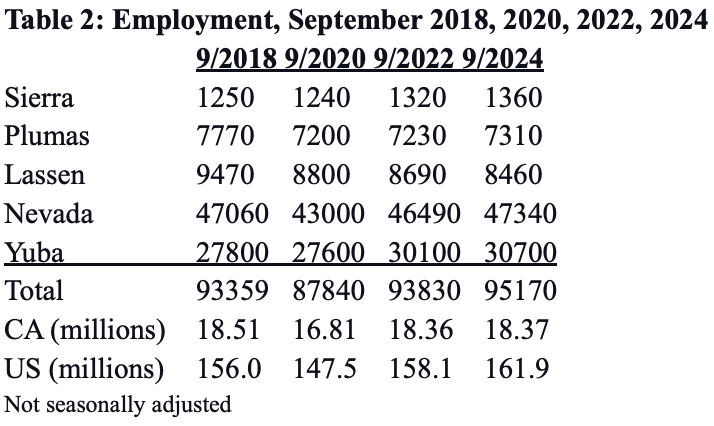
But, now, let’s look at a slightly longer time frame, years before, during, and after COVID ravaged economies worldwide.

As Table 2 indicates, the employment numbers from September 2018-2022 show COVID having a minimal, -1.0%, impact on the number of jobs in Sierra and Yuba counties. At the same time, the counties of Plumas, Lassen, and Nevada lost jobs at rates of 7.4%, 7.1%, and 8.6%, respectively, between 9/2018 and 9/2020. During this period, California lost 9.2% of its jobs while the nation’s employment level shrank by -5.4%.
By September 2022, with the prevalence of the pandemic on the wane, only Sierra and Yuba counties recorded employment levels higher than seen before COVID, while the other counties served by this newspaper continued to offer fewer jobs than before the pandemic.
Two years later, by September 2024, substantial employment gains in Nevada County left only Plumas and Lassen with employment below pre-COVID levels.

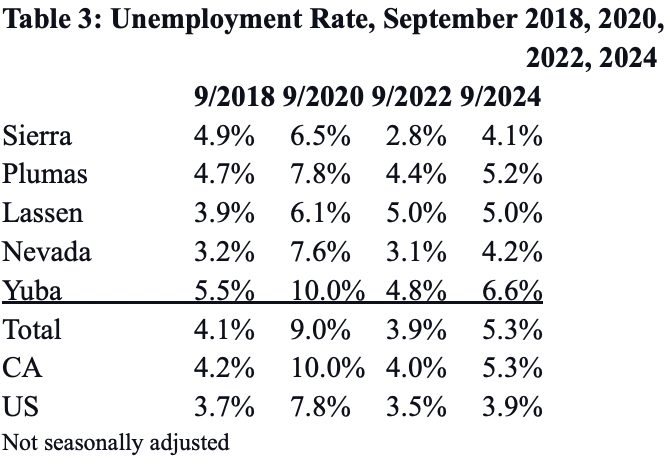
As for the number of people looking for work, relative to those who had jobs, all of the counties in our region showed large increases in the unemployment rate between 2018 and 2020, just as was seen across California and the rest of the US during the pandemic.
However, except for Sierra County, all counties in the Lost Sierra now have higher unemployment rates than they experienced before COVID. In addition, all of the counties, except Lassen County, have seen a rise in the portion of the labor force seeking work over the past two years. In Lassen’s case, where the closure of the state prison in Susanville has led to a significant drop in employment between 2022 and 2024, the stability of the unemployment rate can only be explained by a decline in the total labor force caused by people moving out of the county.
Creating these numbers is a science; it was my job from 1976 to 1978, and we followed strict algorithms based on tiny, monthly samples of employers and revised our estimates when better data and wage reports from all employers arrived each quarter. Census data and national surveys by the US Dept. of Labor were also used to crank out estimates of the self-employed. They still are.
Interpreting these numbers, however, is an art. Each painter of the picture of these statistics is free to place their highlights where they please. For this correspondent, the numbers show the regional economy to have been resilient in the wake of COVID but going essentially sideways, not upwards, over the past two years.
Featured Articles

Storms Bring Heavy Rainfall and Local Disruptions →
December 22, 2025
Sierra County faces power outages and water issues amid heavy rainfall and storm warnings.
215 Animals Seized for Cruelty from Grass Valley Property →
December 22, 2025
Human Remains Found Near South Yuba Bridge in March Identified →
December 17, 2025
Transfer Station Burn Suspended After Community Concerns →
December 16, 2025
Sierra Hardware Plans Extensive Repairs After Flood Damage →
December 8, 2025
